The project management system Project MAP implements the project management method - Earned Value Management.
Work in the project in our system is more organized on the Gantt chart.
The first chart format was developed by Henry Lawrence Gantt in 1910 year.
Until today this format remains one of the de facto standards for visual ordering methods.
Great for accounting and planning work in construction.
The chart supports many easy-to-use functions and features that are demonstrated further.
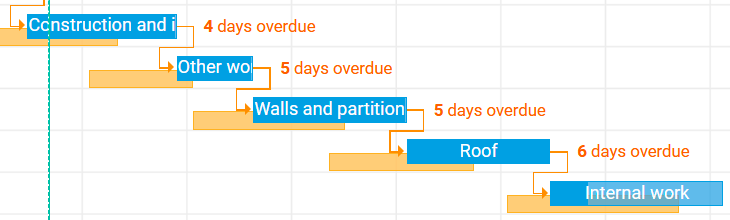
The ability to compare planned work and current data.
Analyze the data, and you can understand at what point, and why something went wrong and the project was delayed.
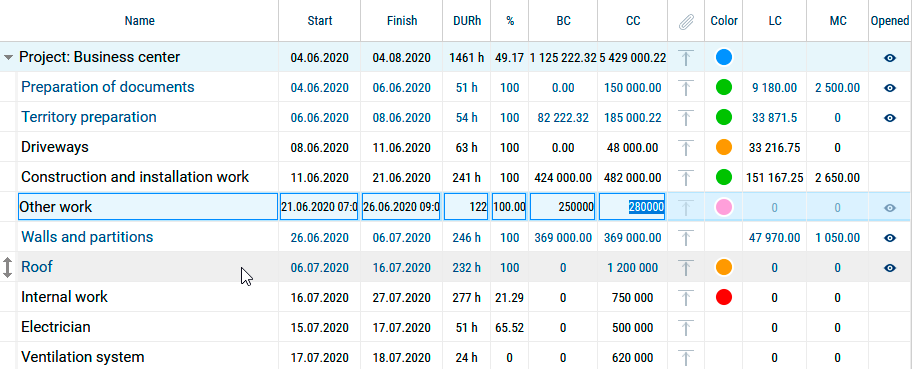
For convenience, you can display frequently used task data in columns in the task list..
Edit them using live editing (without opening the task in separate window) and the changes are applied immediately after editing.
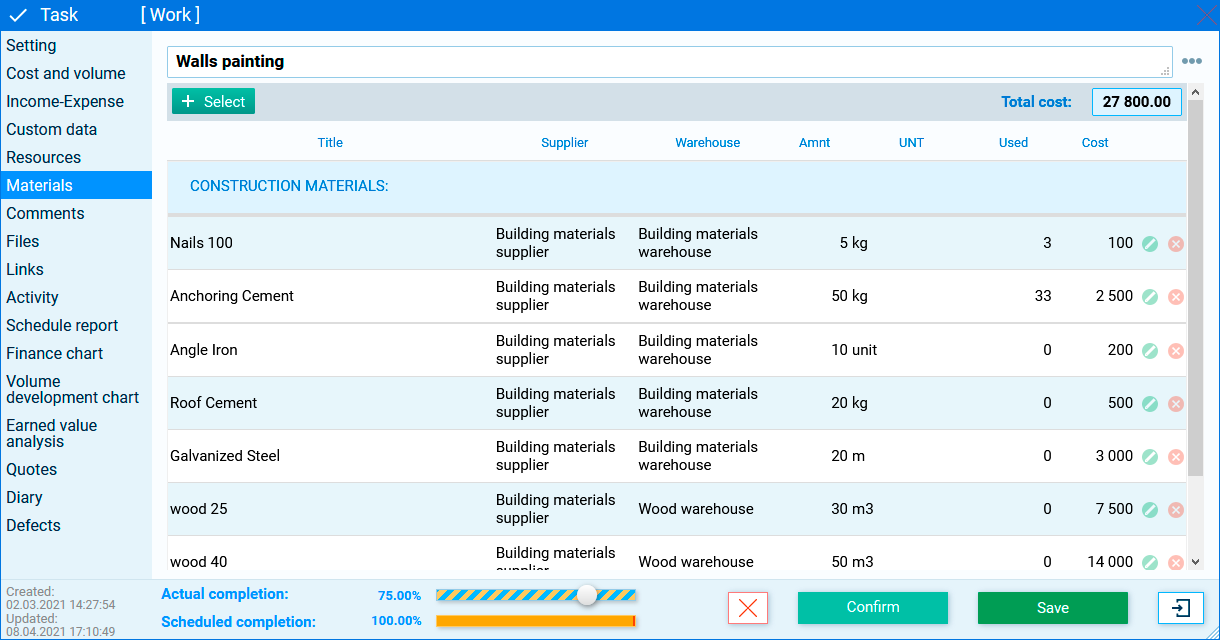
Create a database of materials and select the required work.
Enter material cost information. Track orders and delivery.
Form a resource base and allocate as much as you need to do the job.
Easy to do! Just a couple of clicks.
If the work duration varies, the program helps to track the need for resources and informs about it.
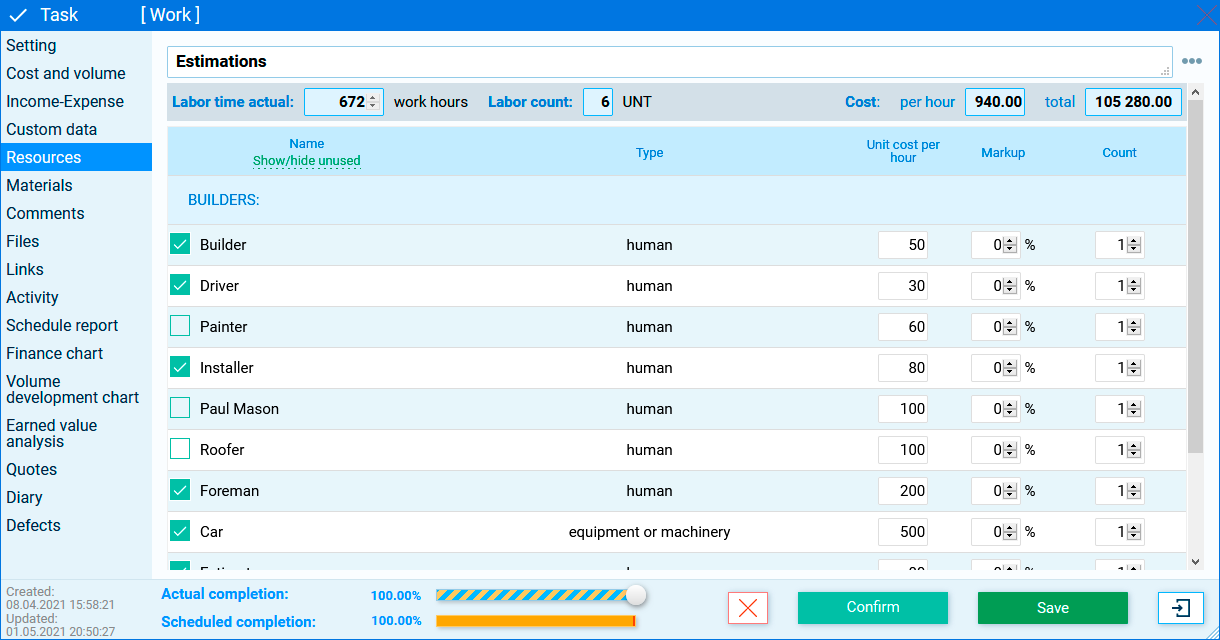
Resource load balancing dashboard helps balance workload.
Helps to track workload of labor resources, as well as machines and mechanisms.

1 - Highlight unfinished overdue tasks, that should already be completed at the moment.
2 - Highlight tasks, that are lag behind the schedule in terms of execution speed.
3 - Highlight tasks, which are ahead of the schedule in terms of speed.
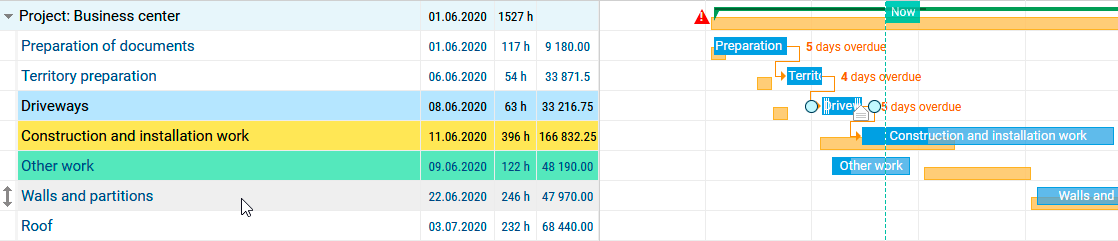
By analyzing the information received, it will be easier for you to analyze the risks associated with the development
Adjust the scale details on your preferences

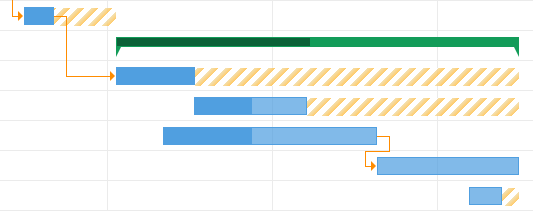
Most likely, you are often disturbed with a question "How much can I postpone the work?".
The function "Show slack" will help you find the time in the calendar chart and show how much more you can move the task to later so that it does not affect the performance of other tasks.
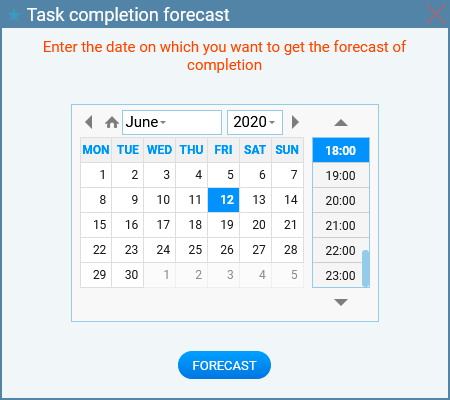
Can you predict what will be the situation with the fulfillment of tasks,
if their implementation continues with the current speed?
There is the Prediction feature to help with this.
The Gantt chart supports two task modes: Auto Planning and Manual.
Auto planning mode - this is a mode for working with related tasks, in which task links are active and can affect other tasks. That is, if the dates of the target task are shifted in time, then the dates of the tasks associated with it will also be shifted (if this relationship is active for them).
Manual mode - this is a mode for working with related tasks, in which task relationships do NOT affect other tasks.
and can move freely on the timeline
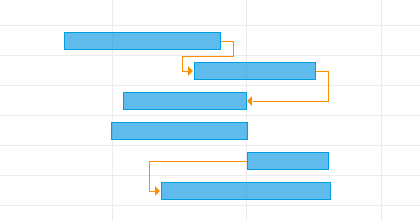
Critical Path Highlight.

Critical path - it is a task or a chain of related tasks, the implementation of the project as a whole depends on its implementation.
When working with a diagram, you can change the tasks duration.
At the same time, the task cost may vary depending on the type of pricing set.
The need for resources may also change.
These calculations are performed on the fly and the program will show you what is the current cost of the task completion and how many resources are required to complete it.

Set up the project stages, and you can view their visualization on the timeline.
Having noted the milestone, the stage associated with the milestone will automatically come.

For example, with the milestone "Construction and installation work completed" the stage "Commissioning" is connected.
You mark that the milestone "Construction and installation work completed" is completed (the task is completed), and the project stage automatically becomes "Commissioning".
The system will notify you.
Your special tasks can be marked with color. For example, red - high priority, purple - non-priority
For more convenient work with tasks, select only those tasks that are important for you at a certain moment

For the convenience of working with tasks, you can customize the appearance of the project at your discretion.
You can hide or display data in the columns of the task list when you need it
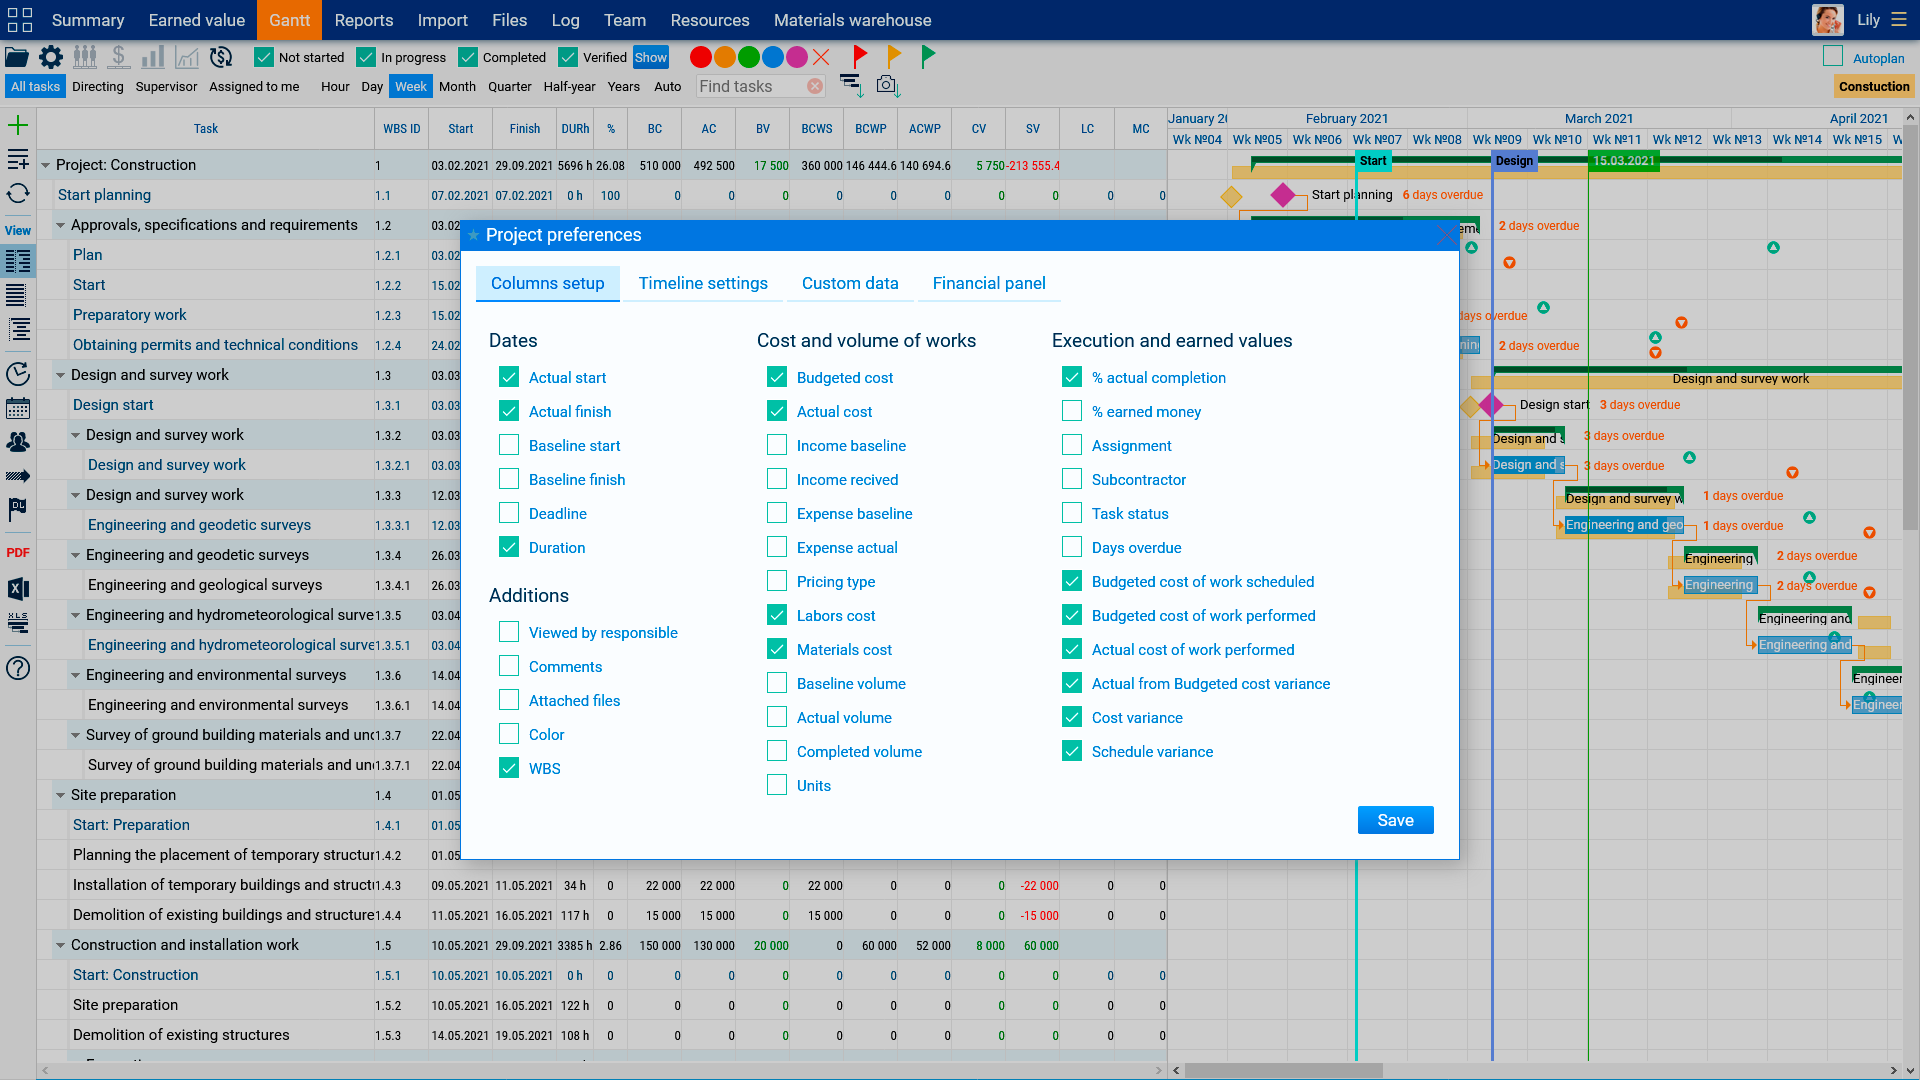
This applies to standard data for the project, as well as to data created by users.
You can change the display of the schedule at your discretion for the convenience of viewing information about tasks
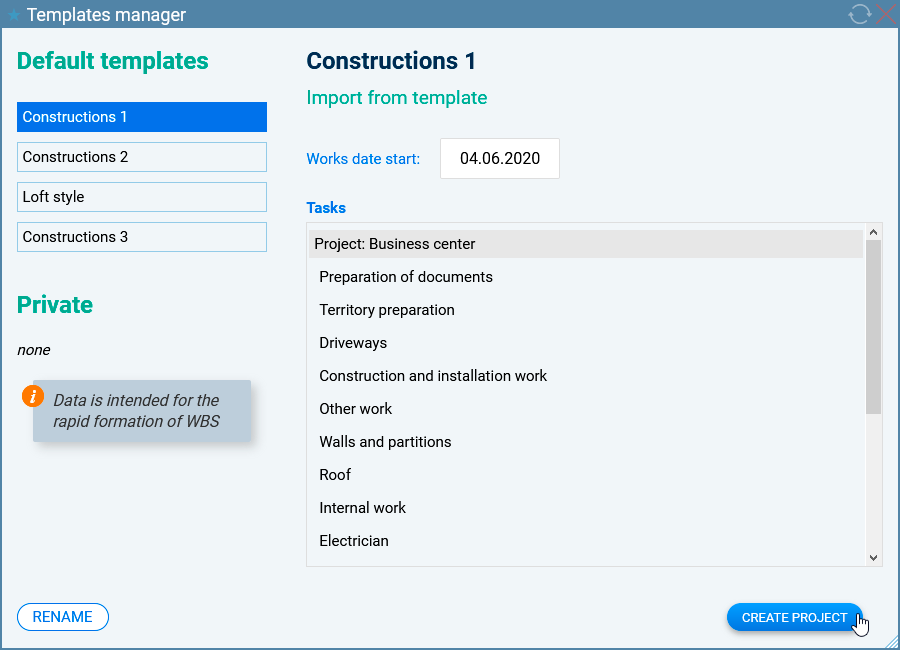
For rapid formation of decomposition work it is possible to use project templates.
You can create your own work templates, which can then be used in standard projects.